
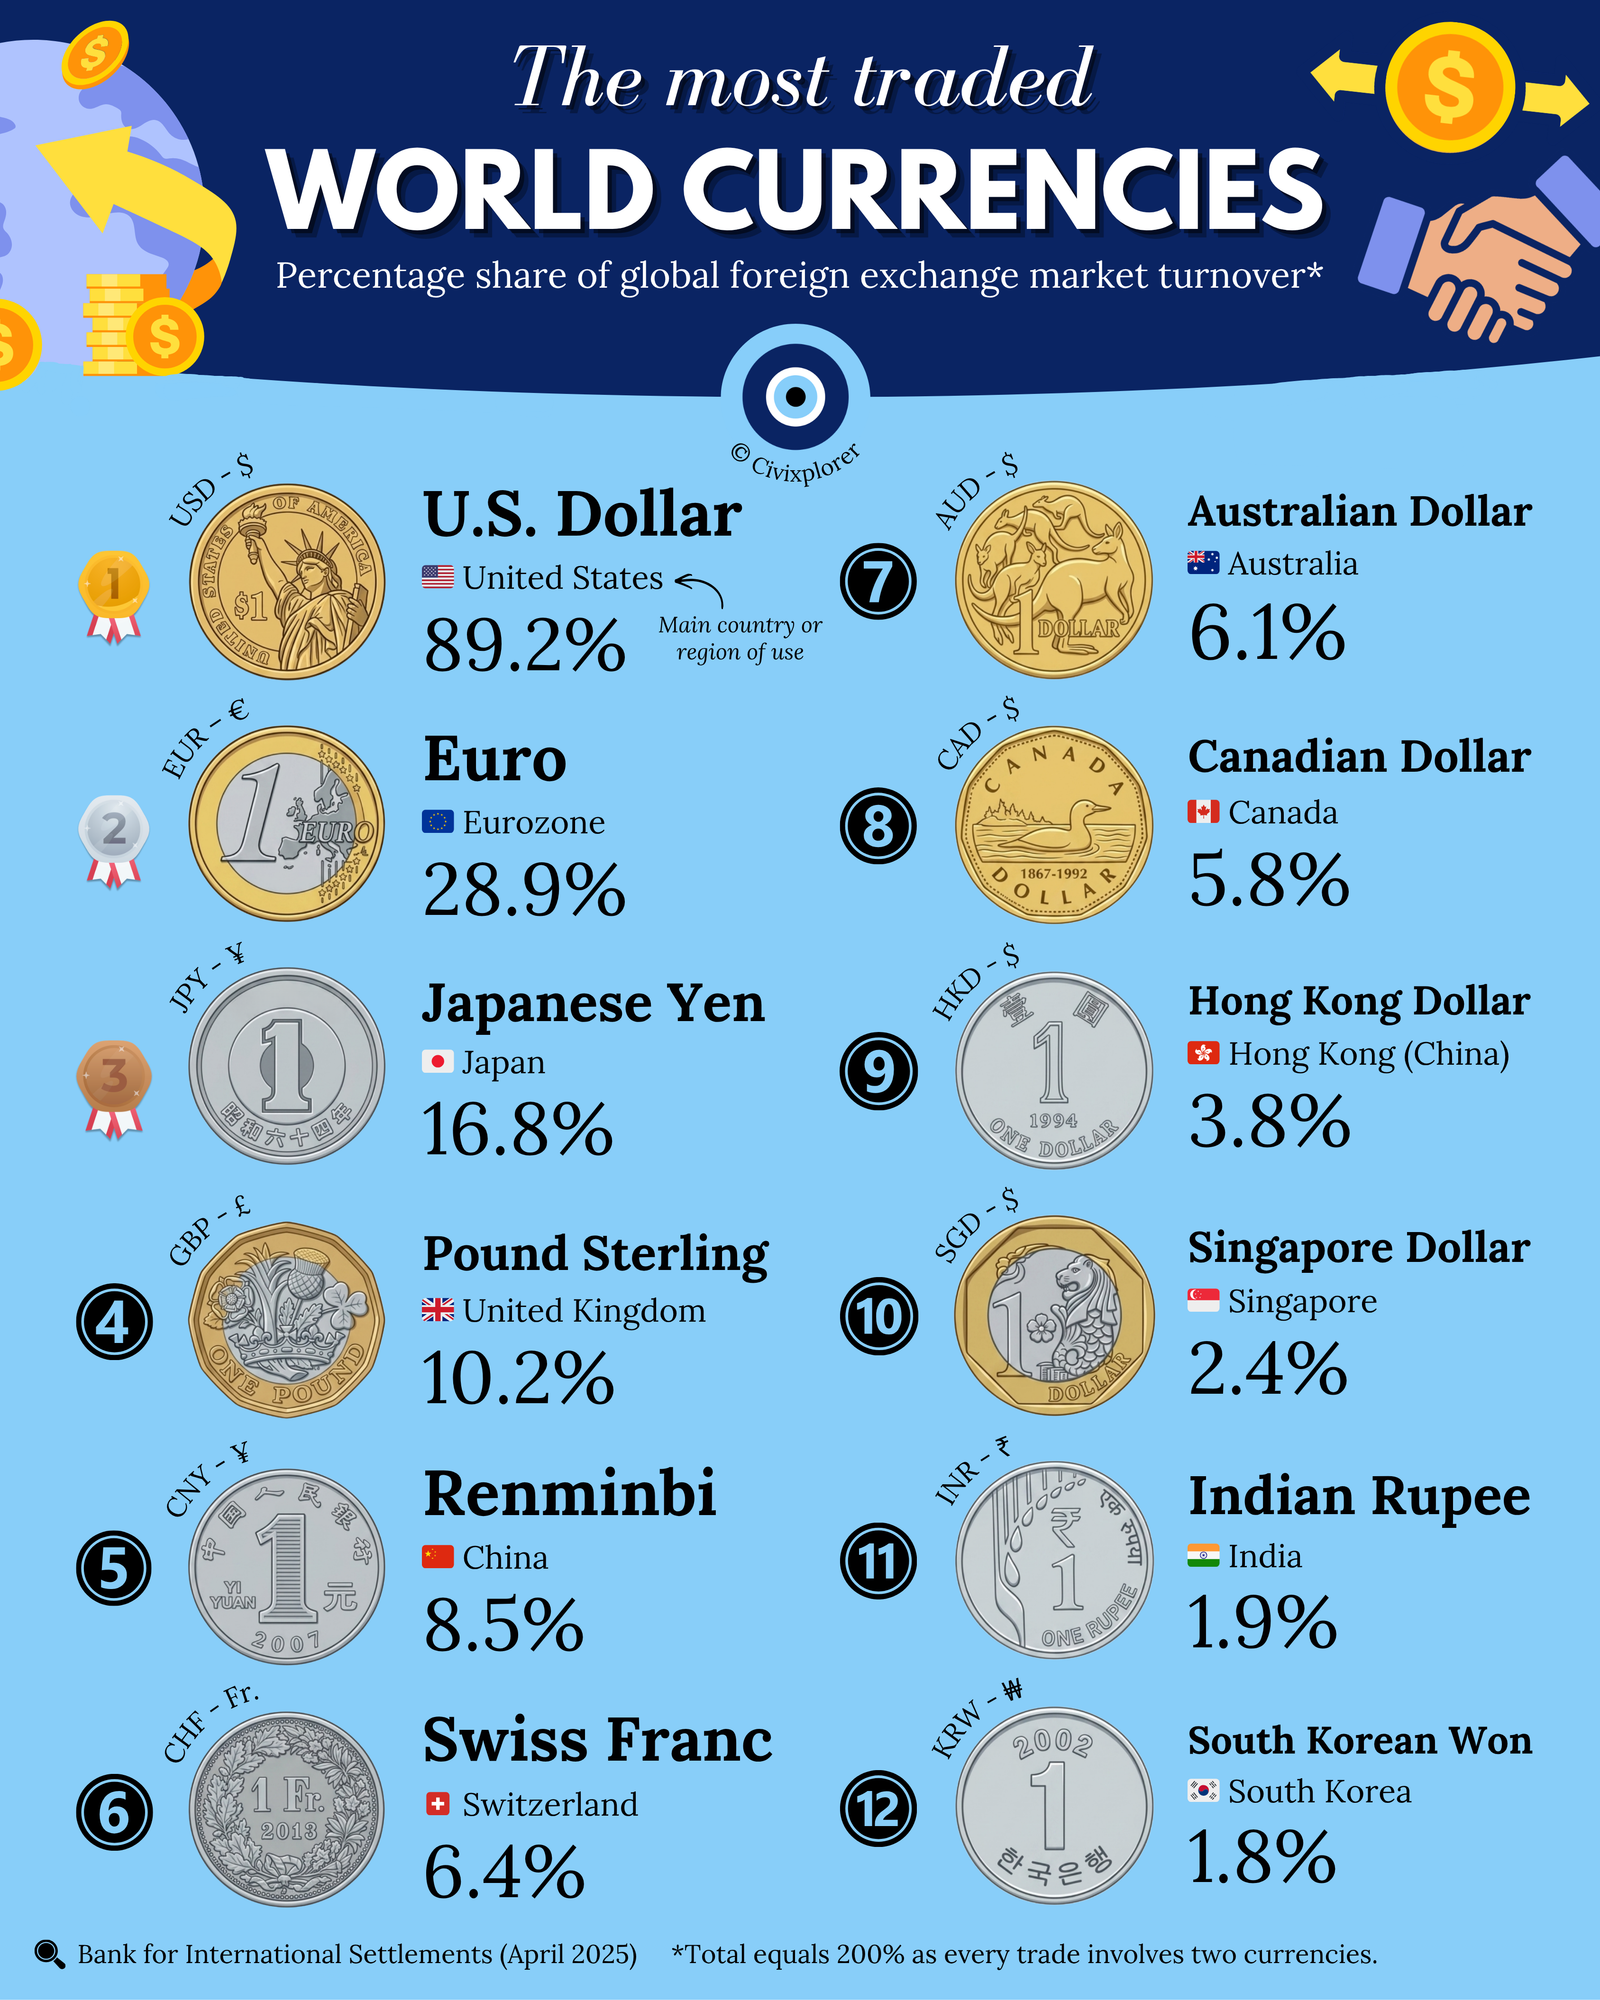
The global foreign exchange (FX) market is the massive, invisible plumbing of the world economy, and according to the 2025 Bank for International Settlements (BIS) Triennial Central Bank Survey, it has reached an unprecedented scale. With a staggering daily average turnover of $9.6 trillion, this market is far larger than global equities or bonds. This activity represents the pulse of international trade, institutional hedging, and geopolitical shifts.
To understand these rankings, one must first grasp the "200% Rule." In the FX market, every trade involves a currency pair—one bought and one sold. Therefore, when measuring individual market shares, the total sum equals 200%. This explains why the U.S. Dollar maintains a dominant 89.2% share, appearing on one side of nearly nine out of every ten trades globally.
The U.S. Dollar (USD) remains the undisputed king of global finance. Its hegemony isn't just about the size of the American economy; it is driven by its role as the primary vehicle currency. The majority of global commodities, including oil, are priced in dollars, and it remains the preferred reserve asset for central banks. Despite fluctuations in U.S. trade policy, the "network effect" of the dollar ensures its liquidity remains unmatched.
The Euro (EUR) holds a firm second place at 28.9%, acting as the regional anchor for Europe and North Africa. While it lacks the global reach of the dollar, it dominates intra-European trade. Meanwhile, the Japanese Yen (16.8%) continues to be a favorite for the "Carry Trade," where investors borrow yen at low interest rates to invest in higher-yielding assets elsewhere, keeping its trading volume disproportionately high compared to Japan's population.
One of the most significant trends in 2025 is the steady rise of the Chinese Renminbi (8.5%). Although China is the world's largest exporter, capital controls still limit the Renminbi's full potential. However, its share has grown consistently since 2013 as China expands its cross-border payment systems and bilateral trade agreements.
Other notable players include "Safe-Haven" currencies like the Swiss Franc (6.4%), which saw a surge in 2025 due to global market volatility, and "Commodity Proxies" like the Australian Dollar (6.1%) and Canadian Dollar (5.8%). These currencies are often used by investors as a liquid way to speculate on the price of raw materials like iron ore and energy.
Finally, the 2025 data highlights the growing influence of Asian financial hubs. The Hong Kong Dollar (3.8%) and Singapore Dollar (2.4%) punch far above their weight as gateways for capital entering the East. Emerging challengers like the Indian Rupee (1.9%) and South Korean Won (1.8%) have now solidified their positions in the top 12, reflecting a long-term shift of the world's economic center of gravity toward Asia.
Below is the complete ranking of the world's most traded currencies based on the 2025 data:
| Rank | Currency | ISO | Primary Region/Jurisdiction | Market Share (%) |
|---|---|---|---|---|
| 1 | U.S. Dollar | USD | United States | 89.2% |
| 2 | Euro | EUR | Eurozone | 28.9% |
| 3 | Japanese Yen | JPY | Japan | 16.8% |
| 4 | Pound Sterling | GBP | United Kingdom | 10.2% |
| 5 | Renminbi | CNY | China | 8.5% |
| 6 | Swiss Franc | CHF | Switzerland | 6.4% |
| 7 | Australian Dollar | AUD | Australia | 6.1% |
| 8 | Canadian Dollar | CAD | Canada | 5.8% |
| 9 | Hong Kong Dollar | HKD | Hong Kong (China) | 3.8% |
| 10 | Singapore Dollar | SGD | Singapore | 2.4% |
| 11 | Indian Rupee | INR | India | 1.9% |
| 12 | South Korean Won | KRW | South Korea | 1.8% |
| 13 | Swedish Krona | SEK | Sweden | 1.6% |
| 14 | Mexican Peso | MXN | Mexico | 1.6% |
| 15 | New Zealand Dollar | NZD | New Zealand | 1.5% |
| 16 | Norwegian Krone | NOK | Norway | 1.3% |
| 17 | New Taiwan Dollar | TWD | Taiwan | 1.2% |
| 18 | Brazilian Real | BRL | Brazil | 0.9% |
| 19 | South African Rand | ZAR | South Africa | 0.8% |
| 20 | Polish Złoty | PLN | Poland | 0.8% |
| 21 | Danish Krone | DKK | Denmark | 0.7% |
| 22 | Indonesian Rupiah | IDR | Indonesia | 0.7% |
| 23 | Turkish Lira | TRY | Turkey | 0.5% |
| 24 | Thai baht | THB | Thailand | 0.5% |
| 25 | Israeli New Shekel | ILS | Israel | 0.4% |
| 26 | Hungarian Forint | HUF | Hungary | 0.4% |
| 27 | Czech Koruna | CZK | Czech Republic | 0.4% |
| 28 | Chilean Peso | CLP | Chile | 0.3% |
| 29 | Philippine Peso | PHP | Philippines | 0.2% |
| 30 | Colombian Peso | COP | Colombia | 0.2% |
| 31 | Malaysian Ringgit | MYR | Malaysia | 0.2% |
| 32 | UAE Dirham | AED | United Arab Emirates | 0.1% |
| 33 | Saudi Riyal | SAR | Saudi Arabia | 0.1% |
| 34 | Romanian Leu | RON | Romania | 0.1% |
| 35 | Peruvian Sol | PEN | Peru | 0.1% |

Comments (0)
Join the Conversation
Login to share your thoughts with the community.
Login to Comment