
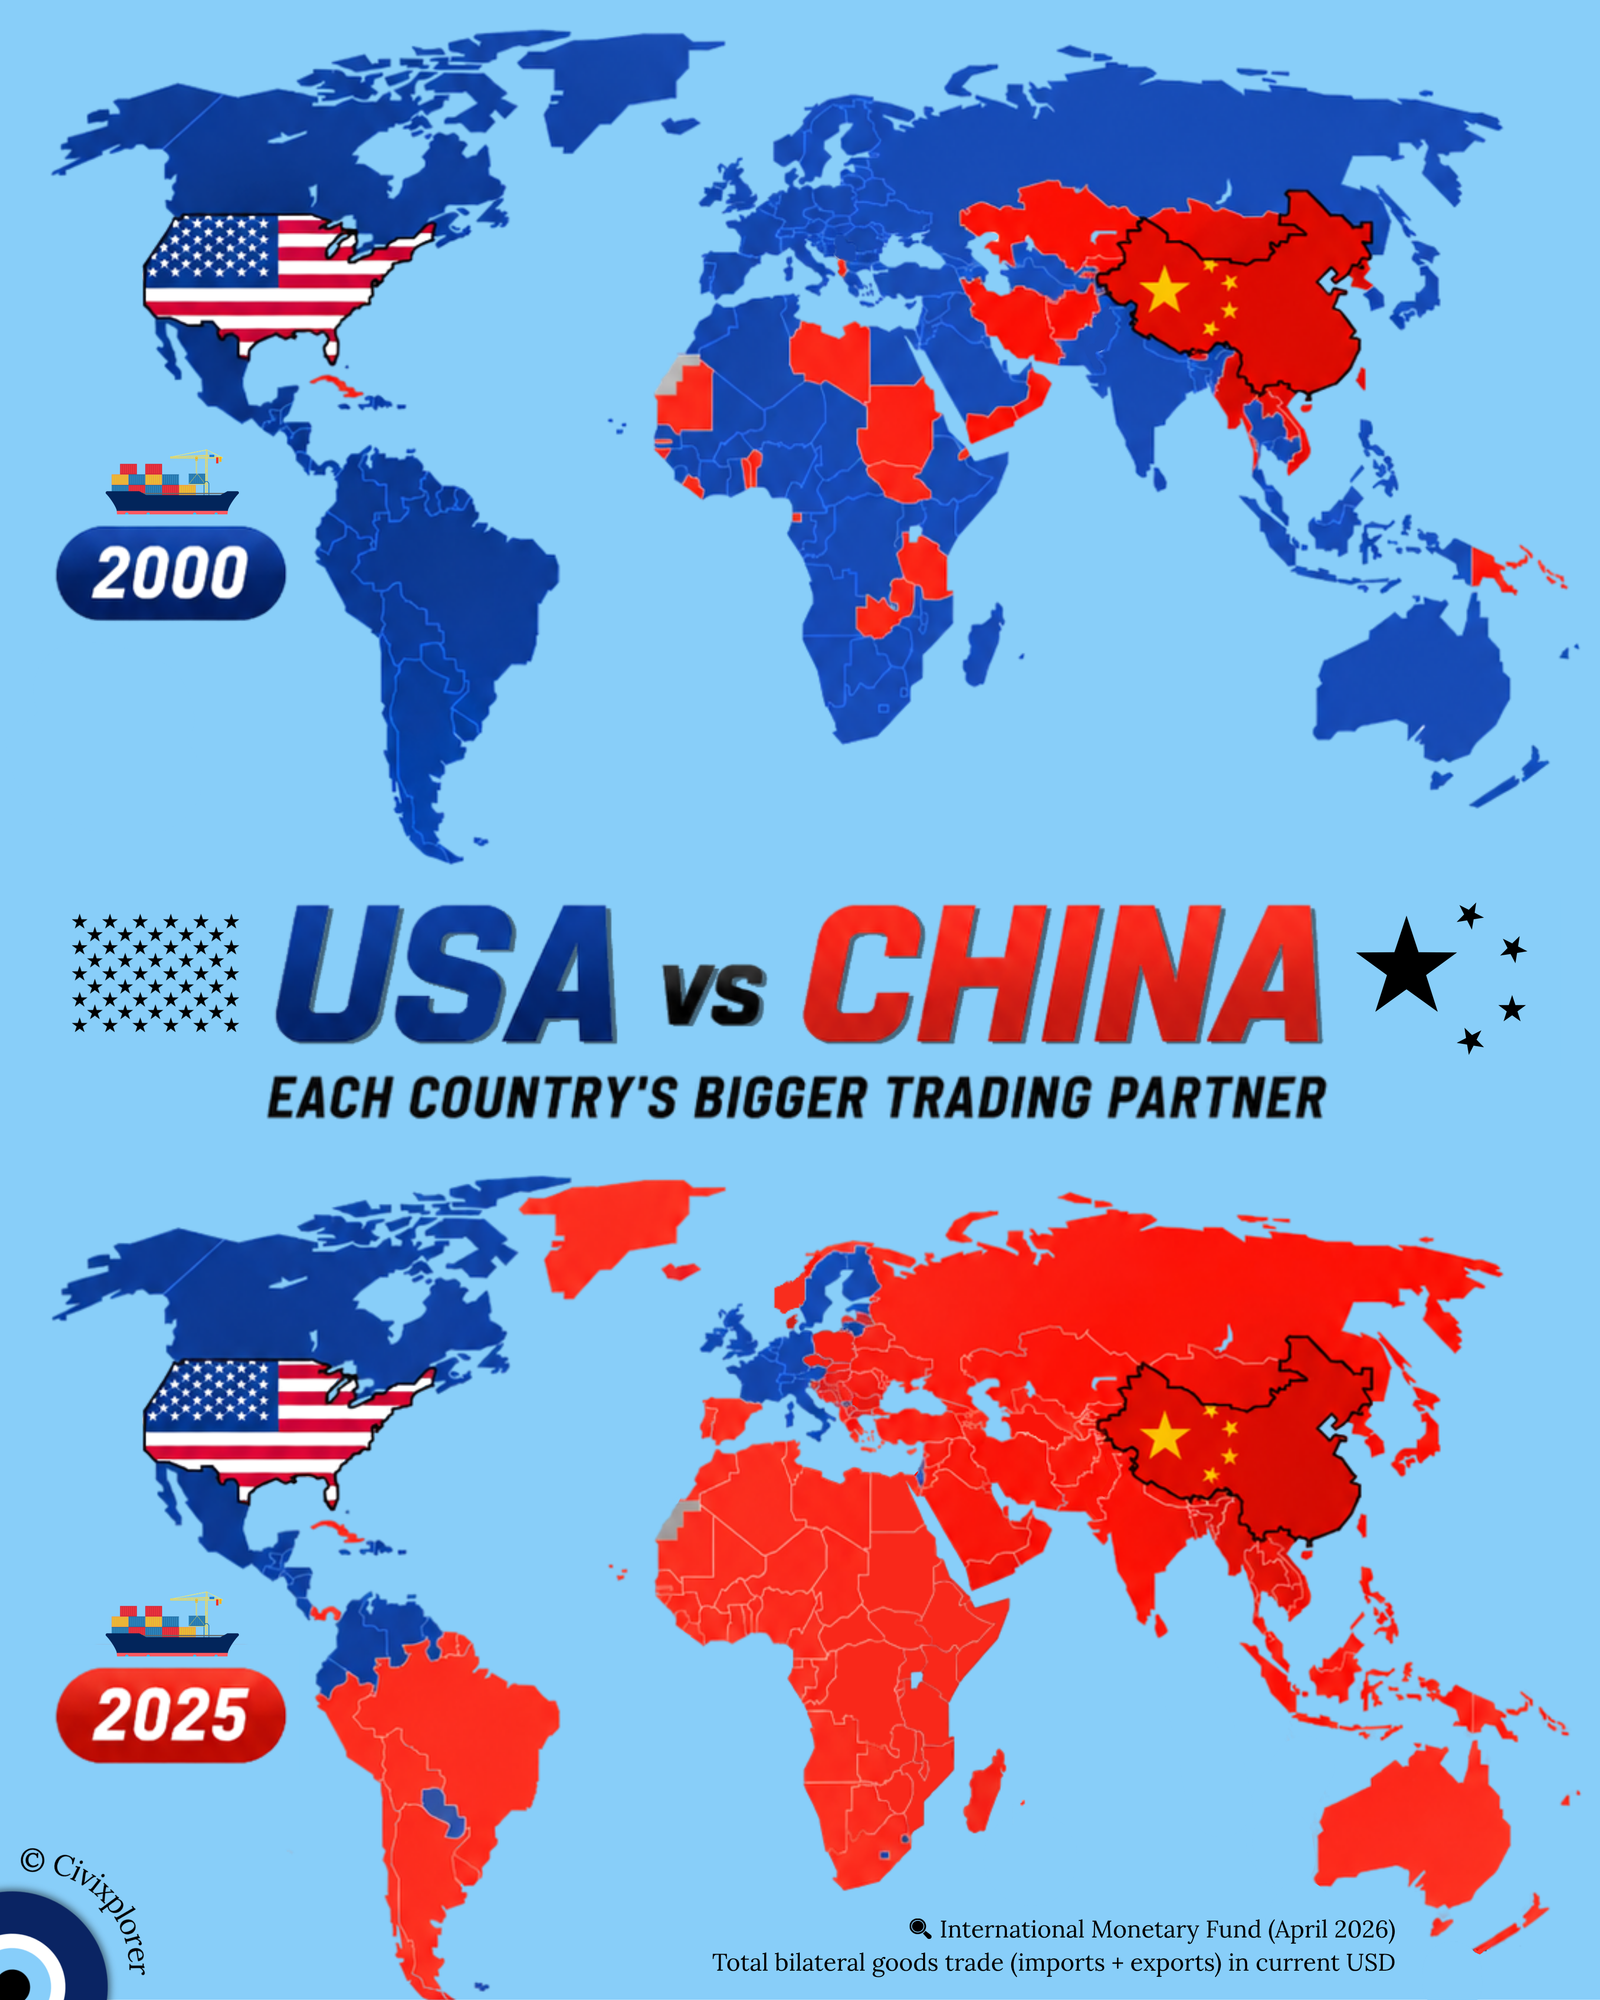
Looking at the global economic landscape between 2000 and 2025, it is impossible to ignore the historical whiplash of the world's trading patterns. The visual shift from a world blanketed in American blue to one dominated by Chinese red represents the most profound macroeconomic transformation of the 21st century. Based on IMF Direction of Trade Statistics, this data tracks total bilateral goods trade—the combined value of physical imports and exports—revealing a dramatic reorientation of global gravity.
The Catalyst: The 2001 Turning Point
In 2000, the United States was at its unipolar zenith, driving global consumption and leading trade architecture. At that time, over 80% of global economies traded more with the US than with China. However, the trajectory changed forever in December 2001 when China joined the World Trade Organization (WTO). This move integrated China’s massive labor force into global supply chains almost overnight, transforming the nation into the undisputed "Factory of the World."
Investigating the Regional Flips
The 2025 map reveals a "red tide" that has swept across the Global South. In South America, nations like Brazil, Chile, and Argentina have pivoted toward Beijing to satisfy China's insatiable appetite for raw materials like soybeans, iron ore, and lithium. Similarly, in Africa, the Belt and Road Initiative (BRI) has facilitated "infrastructure-for-resources" deals, making China the primary trading partner for nearly the entire continent.
In the Indo-Pacific, a fascinating paradox has emerged. While countries like Australia, Japan, and South Korea rely on the United States for security, the gravitational pull of economic geography has made China their primary trading partner. This interconnectedness makes total economic decoupling practically impossible, even for geopolitical rivals.
The Strategic Holdouts
Despite the shift, the United States remains a dominant force in specific regions. North America (Canada and Mexico) remains firmly blue due to the deep integration provided by the USMCA agreement and geographic proximity. In Western Europe, the US has maintained its lead in major economies like the UK and France, partly due to the surge in Liquefied Natural Gas (LNG) exports following the 2022 energy crisis.
What the Map Doesn't Show
While the shift in goods trade is undeniable, it is important to note what this specific data excludes. The US economy remains the world leader in services, intellectual property, and high-tech software, sectors not captured in merchandise trade data. Furthermore, the US remains the global "consumer of last resort," serving as the larger export destination for more than half of the world's economies.
In summary, this map illustrates China’s successful strategy to become the indispensable hub of physical manufacturing. It is a reminder that while we now live in a multipolar trading world, the nature of economic power is shifting from physical "stuff" to services and capital.
Comments (0)
Join the Conversation
Login to share your thoughts with the community.
Login to Comment