
The United States Census Bureau data reveals a demographic landscape that is far from random. Instead, the current distribution of the Black or African American population serves as a profound geographical representation of four centuries of history, economic shifts, and systemic migration patterns. By analyzing this distribution at the county level, we can uncover the enduring imprint of the plantation economy, the industrial pull of the North, and the modern resurgence of Southern metropolitan hubs.
The Legacy of the Black Belt
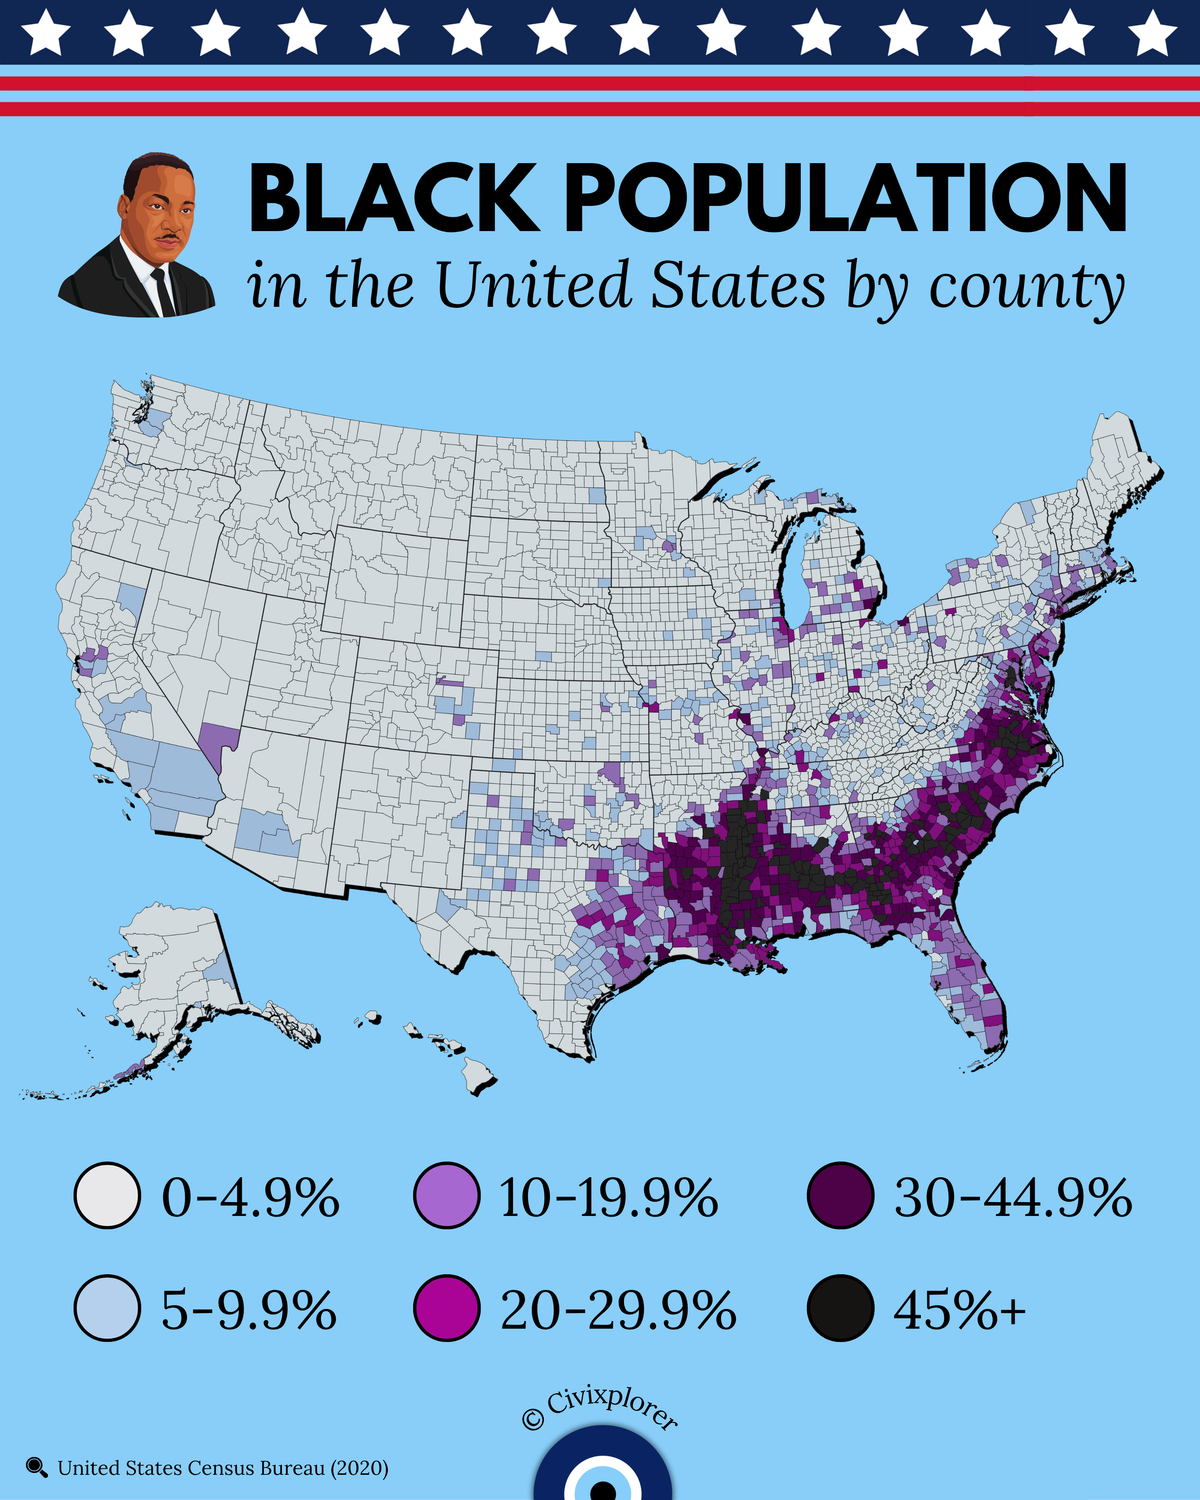
The most striking feature of the American demographic map is the dense, crescent-shaped concentration stretching from eastern Texas through the Mississippi River Delta and into the Carolinas and Virginia. This region, historically known as the Black Belt, originally referred to the rich, dark topsoil that made the area the epicenter of the 19th-century cotton and tobacco plantation economy.
This fertile soil became the site of intensive forced labor during the era of slavery. Following emancipation, systemic economic structures like sharecropping and tenant farming kept many families tied to these rural geographies for generations. Today, many counties in the rural Deep South—particularly in Mississippi and Alabama—maintain Black population shares exceeding 45 percent, standing as a direct demographic legacy of this era.
The Great Migration and Urban Nodes
Outside of the South, the map highlights localized, high-density nodes in the Midwest and Northeast. Cities such as Chicago, Detroit, Cleveland, and Philadelphia stand out as isolated pockets of concentration. These represent the destinations of the Great Migration (1916–1970), during which approximately six million African Americans fled the oppressive Jim Crow laws of the South in search of industrial and manufacturing jobs.
Unlike the diffused settlement patterns of other groups, these populations were often concentrated in specific inner-city neighborhoods due to discriminatory practices like redlining. This historical "urbanization" explains why Northern demographic patterns appear as concentrated county-level "islands" rather than broad regional spreads.
The West Coast and Second Great Migration
The presence of significant Black populations in Los Angeles, Oakland, and Las Vegas is largely a result of the Second Great Migration during and after World War II. The buildup of the military-industrial complex created a boom in defense, shipbuilding, and aerospace jobs. Migrants from the western South, such as Texas and Louisiana, moved westward along railroad lines to seize these new opportunities, establishing permanent communities that remain vital to the West Coast's cultural fabric today.
The New Great Migration: A Return to the South
While historical patterns remain visible, modern data also captures a contemporary trend: the "New Great Migration." Since the late 20th century, there has been a notable reverse migration of Black professionals and middle-class families back to Southern economic hubs. Cities like Atlanta, Charlotte, Houston, and Dallas have seen significant growth. Driven by lower costs of living, job growth in the Sun Belt, and a desire to return to cultural roots, this movement is reinforcing the demographic density of the South while layering new professional and suburban dynamics onto the map.
Geographic Voids and Historical Absence
Equally telling are the regions where the Black population is nearly absent, such as the Mountain West, the Great Plains, and rural Northern New England. These areas were generally incompatible with the plantation-style agriculture of the 19th century and were often bypassed by the industrial pull of the Great Migration. Furthermore, exclusionary historical policies and the presence of "sundown towns" discouraged settlement in these interior regions, leaving them demographically distinct from the rest of the country.
Ultimately, the 2020 demographic snapshot is a story of path dependence. It shows us that 19th-century forced settlement created concentrations that 20th-century migrations modified but never eliminated. The map is not just a collection of percentages; it is a visual archive of resilience and a long struggle for equality that continues to shape the American landscape.
Comments (0)
Join the Conversation
Login to share your thoughts with the community.
Login to Comment