
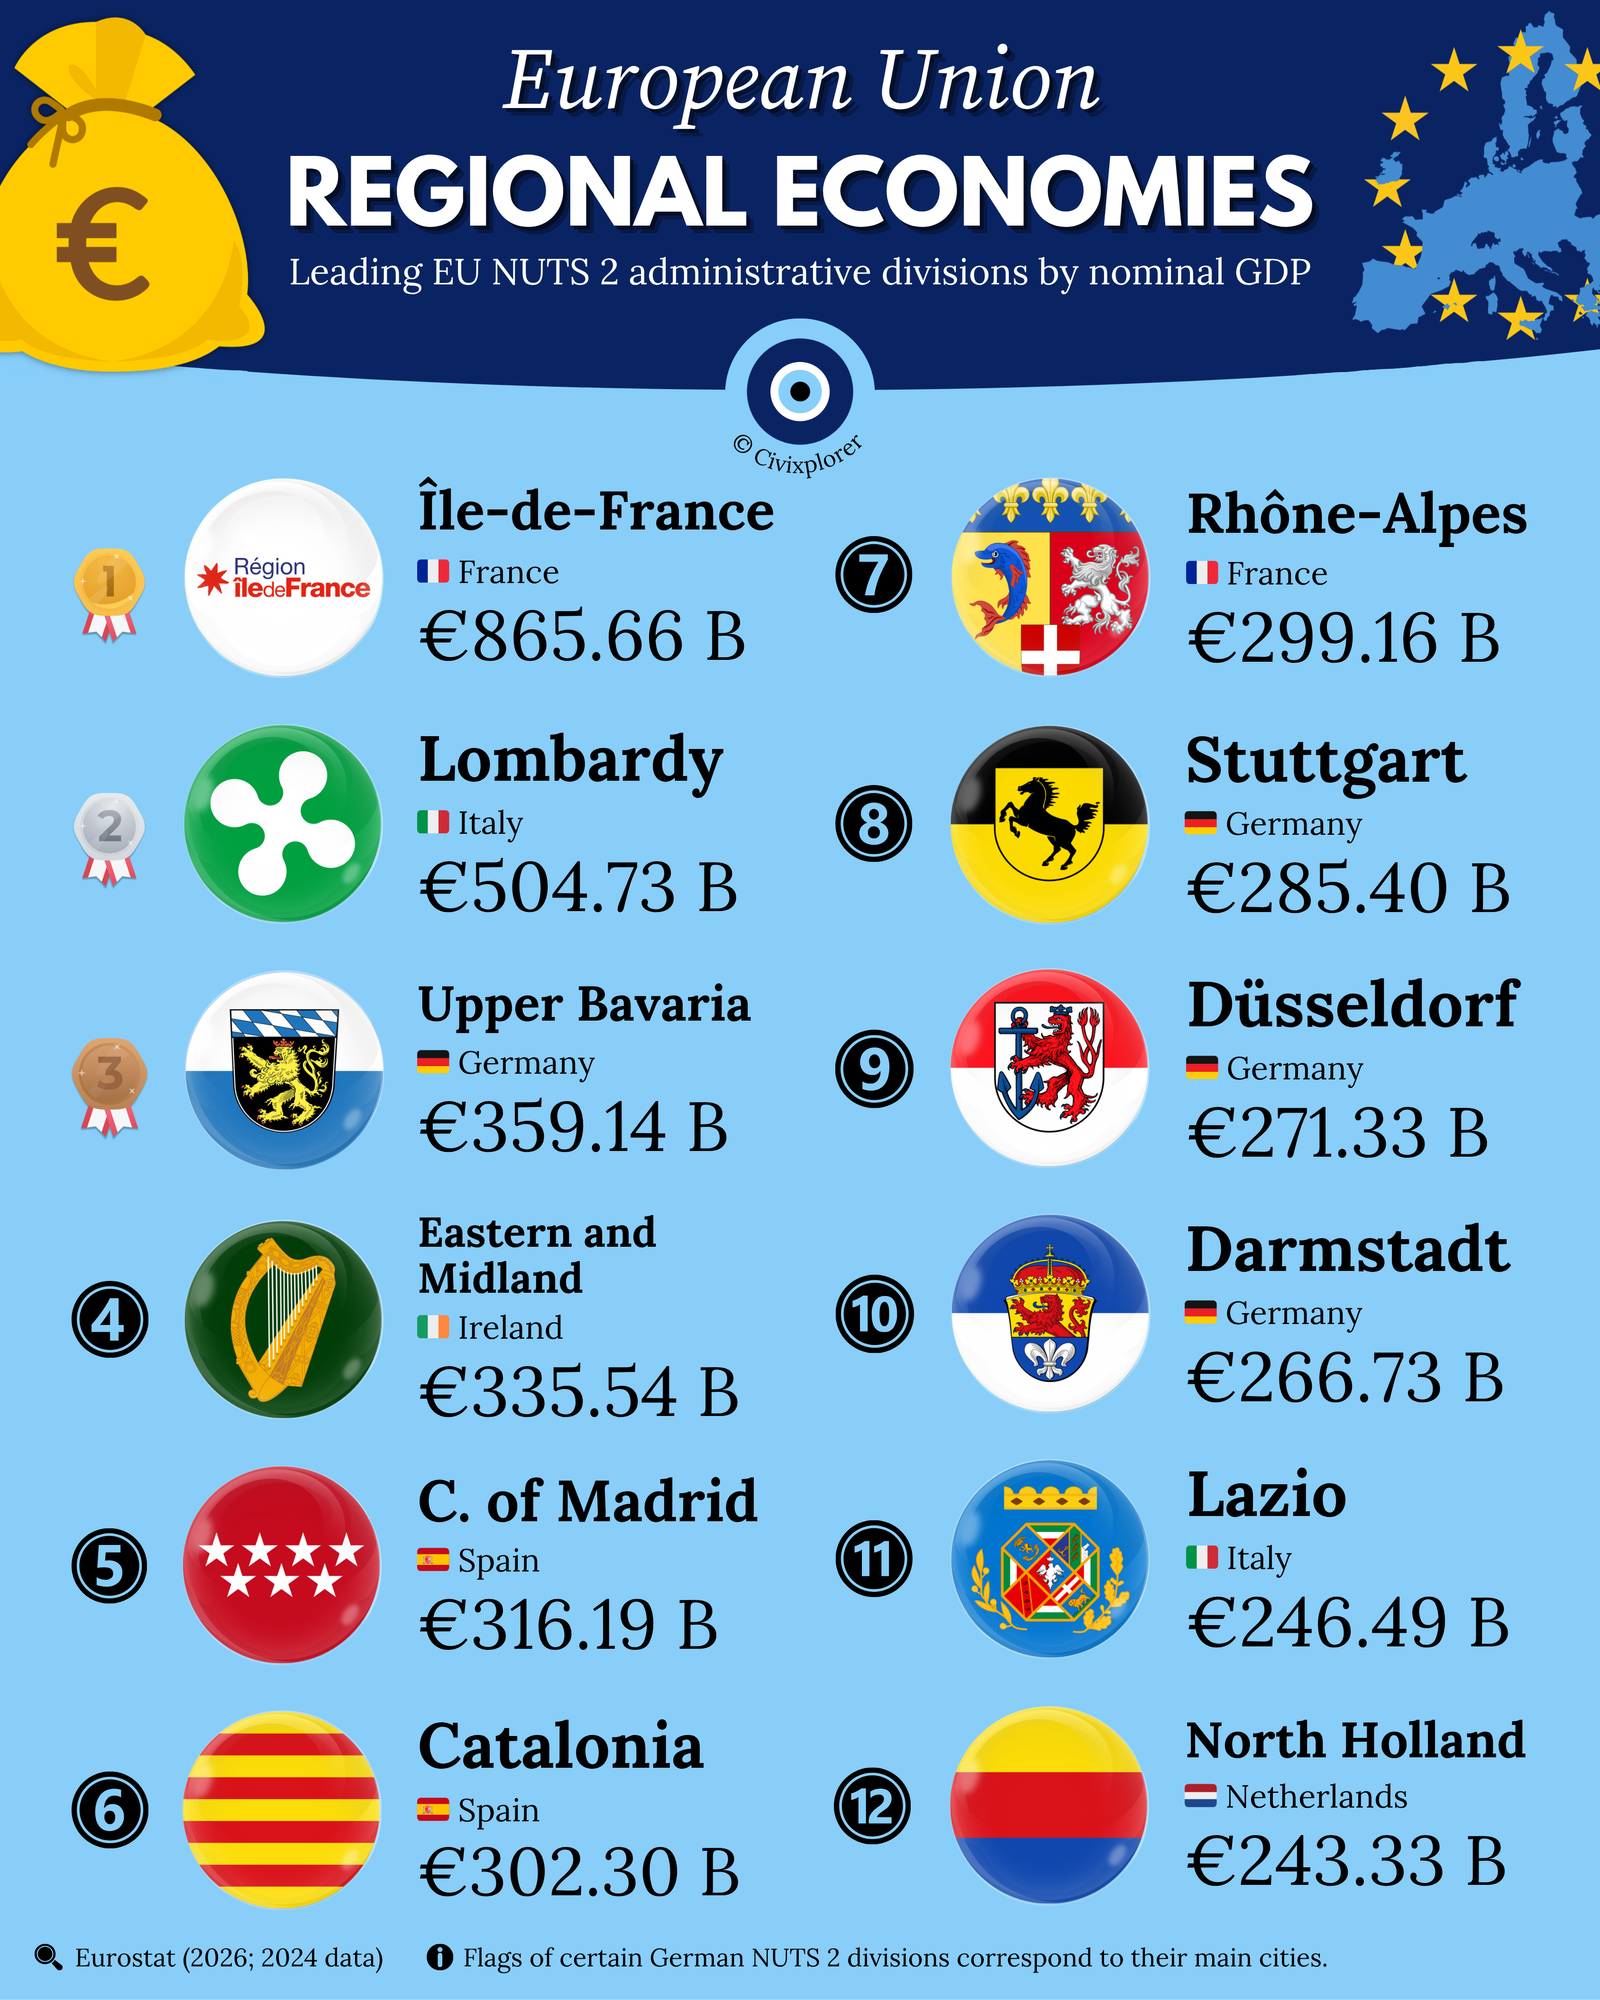
The economic landscape of the European Union is not a uniform field; it is a complex map of high-output hubs and industrial powerhouses. To understand where the EU’s economic mass actually sits, we must look at NUTS 2 regions—the standard territorial units used by Eurostat for statistical analysis. By examining nominal GDP at current market prices, we can identify the specific territories that function as the primary engines of the continent.
The most recent data released in 2026 for the 2024 fiscal year highlights a staggering concentration of wealth. While there are 244 NUTS 2 regions across the EU, the top 10 largest alone generate approximately 21% of the total EU economic output. This visualization serves as a portrait of European economic strategies, distinguishing between centralized states, federal networks, and investment-driven anomalies.
The French Behemoth: Île-de-France
At the summit of the ranking sits Île-de-France, the region encompassing Paris, with a massive GDP of €865.66 billion. This single region produces roughly 30% of France’s entire national GDP. Its dominance is a textbook example of extreme economic centralization. As a unitary state, France has spent centuries concentrating its political, administrative, and infrastructural power in the capital. Today, this creates a "virtuous cycle" where the presence of the CAC 40 headquarters, the La Défense business district, and elite research networks continue to attract global talent and investment, leaving other French regions like Rhône-Alpes (€299.16 billion) far behind.
Germany’s Polycentric Engine
In contrast to the French model, Germany—the EU's largest national economy—demonstrates polycentric strength. Notably, Germany does not hold the first or second spot. Instead, its wealth is distributed across multiple high-performing hubs. Upper Bavaria (€359.14 billion), driven by Munich’s automotive and tech clusters, leads the German entries, followed closely by Stuttgart (€285.40 billion), Düsseldorf (€271.33 billion), and Darmstadt (€266.73 billion). This decentralized structure is a result of Germany’s federal system, which fosters competition and specialization among different states rather than funneling all resources into Berlin.
The "Irish Anomaly": Eastern and Midland
Ranking fourth with €335.54 billion is Ireland's Eastern and Midland region, which includes Dublin. This figure is extraordinary given the region's relatively small population. However, economists note that Irish GDP is heavily distorted by multinational accounting practices. As the European headquarters for US tech and pharmaceutical giants, Dublin records vast amounts of intellectual property revenue and global profits that may not fully reflect the material wealth of the local citizens. For a truer picture of domestic prosperity, metrics like Modified Gross National Income (GNI)* are often preferred.
Regional Rivalries and Divides
The data also tracks the shifting gravity of economic power within national borders. In Spain, the Community of Madrid (€316.19 billion) has successfully utilized the "capital effect" to edge past Catalonia (€302.30 billion), which was historically the country's undisputed industrial engine. Meanwhile, in Italy, the massive lead of Lombardy (€504.73 billion) over Lazio (€246.49 billion) underscores a profound North-South divide. Lombardy remains the industrial and financial anchor of Italy, while the capital region of Rome relies more heavily on administrative and service sectors.
Ultimately, this ranking is more than just a list of wealthy areas; it is a map of agglomeration advantages. Whether driven by historical path dependence, institutional choices, or global connectivity, these 12 regions represent the specialized hubs that will continue to shape the EU’s competitiveness and growth in the years to come.
Top 30 EU Regional Economies by Nominal GDP
| Rank | Region (NUTS 2) | Country | GDP (Billions) |
|---|---|---|---|
| 1 | Île-de-France | France | €865.66 B |
| 2 | Lombardy | Italy | €504.73 B |
| 3 | Upper Bavaria | Germany | €359.14 B |
| 4 | Eastern and Midland | Ireland | €335.54 B |
| 5 | Community of Madrid | Spain | €316.19 B |
| 6 | Catalonia | Spain | €302.30 B |
| 7 | Rhône-Alpes | France | €299.16 B |
| 8 | Stuttgart | Germany | €285.40 B |
| 9 | Düsseldorf | Germany | €271.33 B |
| 10 | Darmstadt | Germany | €266.73 B |
| 11 | Lazio | Italy | €246.49 B |
| 12 | North Holland | Netherlands | €243.33 B |
| 13 | Cologne | Germany | €236.73 B |
| 14 | South Holland | Netherlands | €231.25 B |
| 15 | Provence-Alpes-Côte d'Azur | France | €217.94 B |
| 16 | Andalusia | Spain | €212.36 B |
| 17 | Berlin | Germany | €207.85 B |
| 18 | Veneto | Italy | €201.25 B |
| 19 | Emilia-Romagna | Italy | €198.40 B |
| 20 | Southern | Ireland | €182.32 B |
| 21 | Stockholm | Sweden | €179.24 B |
| 22 | Capital Region of Denmark | Denmark | €174.14 B |
| 23 | North Brabant | Netherlands | €171.62 B |
| 24 | Piemonte | Italy | €164.17 B |
| 25 | Hamburg | Germany | €162.58 B |
| 26 | Karlsruhe | Germany | €157.76 B |
| 27 | Warsaw | Poland | €156.56 B |
| 28 | Arnsberg | Germany | €156.49 B |
| 29 | Valencian Community | Spain | €148.28 B |
| 30 | Pays de la Loire | France | €147.79 B |

Comments (0)
Join the Conversation
Login to share your thoughts with the community.
Login to Comment