
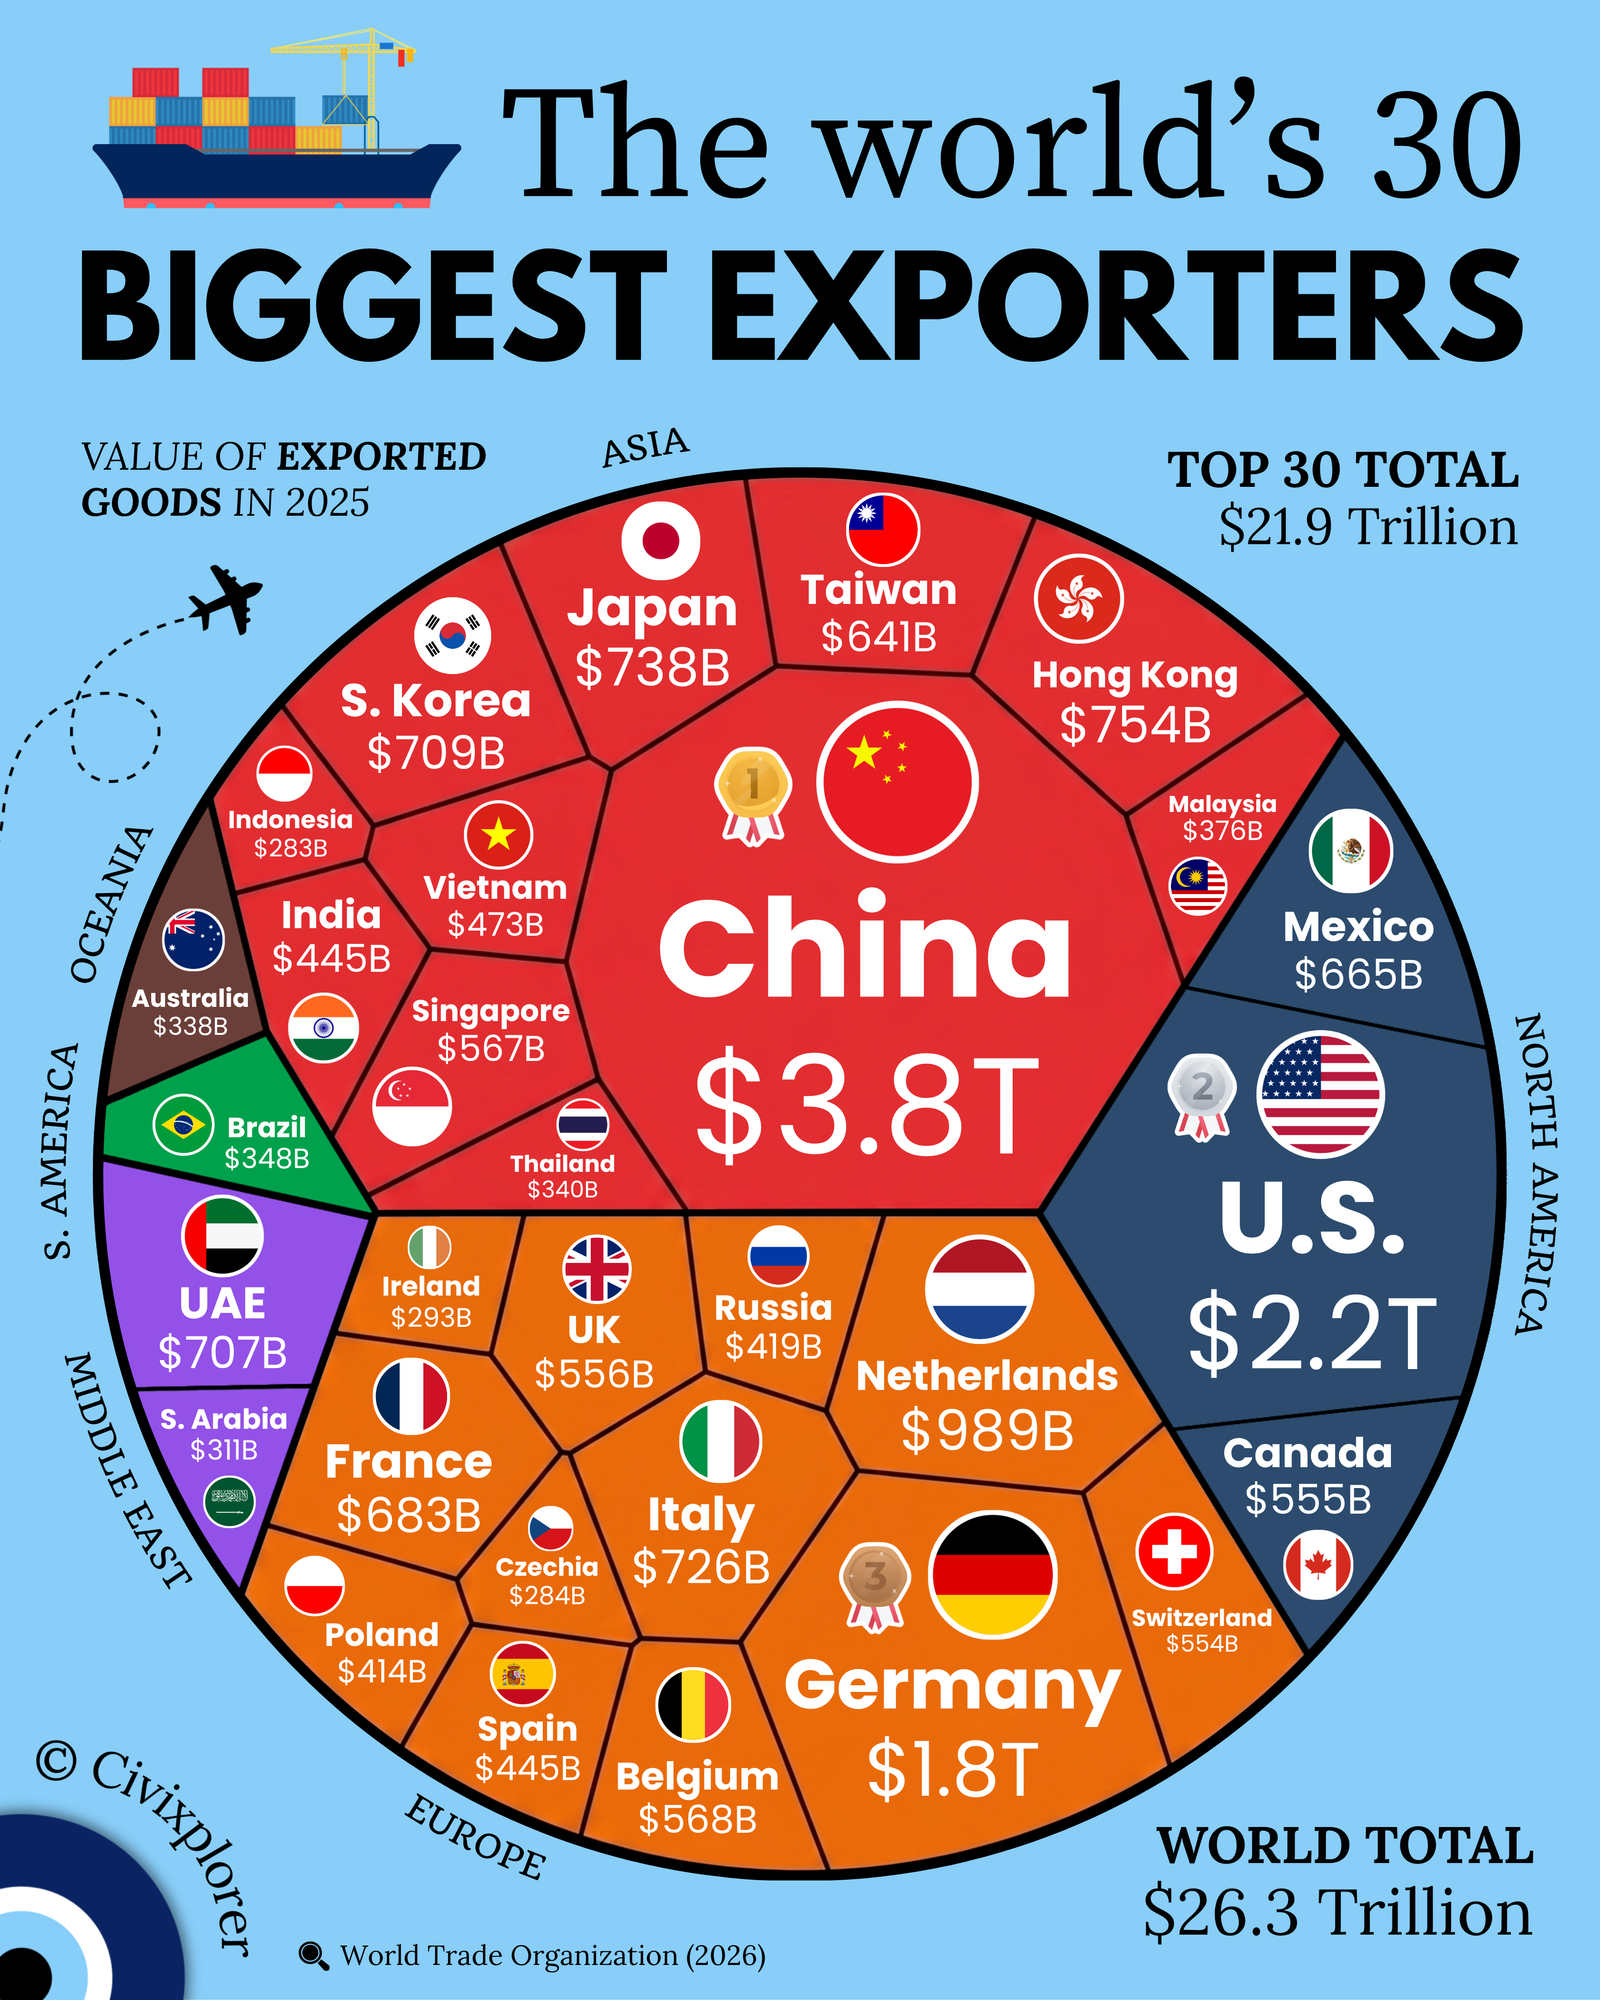
The global economy is a complex web of interdependence, but the flow of physical goods is surprisingly concentrated. According to the latest data from the World Trade Organization (WTO), the total value of global merchandise exports reached $26.3 trillion in 2025. However, a closer look at the data reveals that just 30 nations command an overwhelming $21.9 trillion of that total. This means that roughly 83% of all global trade value is controlled by slightly more than 15% of the world's countries.
The Industrial Titans: China, the U.S., and Germany The global export landscape is anchored by three distinct economic powerhouses that together account for approximately $7.8 trillion in total exports.
China remains the undisputed heavyweight, exporting $3.8 trillion in goods—nearly double the value of the United States. While once known as the "world's factory" for low-cost goods, China’s 2025 dominance is driven by a strategic pivot toward high-end green manufacturing, specifically electric vehicles (EVs), lithium-ion batteries, and solar products.
The United States ranks second at $2.2 trillion. While the U.S. is the world's largest consumer market and a leader in services (which are not included in this merchandise-only data), its goods exports remain top-tier due to high-value sectors like aerospace, pharmaceuticals, and advanced technology.
Germany secures the third spot with $1.8 trillion. This is a remarkable feat for a nation of 83 million people, driven by its Mittelstand—specialized medium-sized enterprises—and a global reputation for precision engineering in automotive and industrial machinery.
The "Gateway" Phenomenon and the Rotterdam Effect One of the most fascinating insights from the 2025 data is how small nations like the Netherlands ($989 billion) and Hong Kong ($754 billion) out-export much larger industrial economies. This is known as the "Rotterdam Effect" or the entrepôt phenomenon. These regions act as global logistics hubs; goods often arrive from one part of the world, are legally cleared through customs, and are immediately re-exported to their final destinations.
Resource Wealth vs. Value-Added Economies The data also highlights a stark divide between economies based on finished technology and those based on raw materials. While nations like Taiwan and South Korea rank high due to semiconductors and high-tech exports, commodity giants like Brazil ($348 billion) and Australia ($338 billion) sit lower on the list. Raw materials, while essential, generally yield lower aggregate financial returns than the highly engineered goods produced by the world’s manufacturing hubs.
The Global Divide
Perhaps the most profound takeaway is the absence of certain regions from the top tier of trade. Not a single African nation appears in the top 30, and South America is represented only by Brazil. This underscores a systemic lack of domestic manufacturing and value-addition in these regions, which continue to export unrefined raw materials while importing finished high-value goods.
Below is the detailed ranking of the top 30 global exporters by the value of goods shipped in 2025:
| Rank | Country | Export Value (USD) |
|---|---|---|
| 1 | China | $3.8 Trillion |
| 2 | United States | $2.2 Trillion |
| 3 | Germany | $1.8 Trillion |
| 4 | Netherlands | $989 Billion |
| 5 | Hong Kong | $754 Billion |
| 6 | Japan | $738 Billion |
| 7 | Italy | $726 Billion |
| 8 | South Korea | $709 Billion |
| 9 | United Arab Emirates | $707 Billion |
| 10 | France | $683 Billion |
| 11 | Mexico | $665 Billion |
| 12 | Taiwan | $641 Billion |
| 13 | Belgium | $568 Billion |
| 14 | Singapore | $567 Billion |
| 15 | United Kingdom | $556 Billion |
| 16 | Canada | $555 Billion |
| 17 | Switzerland | $554 Billion |
| 18 | Vietnam | $473 Billion |
| 19 | India | $445 Billion |
| 20 | Spain | $445 Billion |
| 21 | Russia | $419 Billion |
| 22 | Poland | $414 Billion |
| 23 | Malaysia | $376 Billion |
| 24 | Brazil | $348 Billion |
| 25 | Thailand | $340 Billion |
| 26 | Australia | $338 Billion |
| 27 | Saudi Arabia | $311 Billion |
| 28 | Ireland | $293 Billion |
| 29 | Czechia | $284 Billion |
| 30 | Indonesia | $283 Billion |
Comments (0)
Join the Conversation
Login to share your thoughts with the community.
Login to Comment