
The video game industry has undergone a radical transformation over the last five decades, evolving from a niche hobby into a global cultural powerhouse. This comprehensive ranking of the best-selling video game consoles worldwide as of May 2026 provides a fascinating snapshot of how innovation, market timing, and brand loyalty have shaped the hardware we use to play.
At the absolute summit of the industry sits the PlayStation 2 (160.01 million units). Despite being released over 26 years ago, Sony’s masterpiece remains unchallenged at the #1 spot. Its success was the result of a "perfect storm": it acted as an affordable DVD player during the format's explosion, featured full backward compatibility with the original PlayStation, and boasted a library of over 4,000 titles.
The battle for second place has reached a historic milestone in 2026. The Nintendo Switch (154.45 million) has officially dethroned the Nintendo DS (154.02 million) to become the best-selling Nintendo hardware of all time. The Switch’s success stems from its revolutionary hybrid design, which consolidated Nintendo’s handheld and home console markets into a single ecosystem. This strategy proved resilient, especially during the global gaming boom of the early 2020s.
Japanese manufacturers Sony and Nintendo continue to dominate the top of the charts, highlighting their historic leadership in consumer electronics. While Sony has maintained a consistent presence with the PlayStation 4 (117.20 million) and the PlayStation 5 (91.52 million), Nintendo has mastered the portable and "blue ocean" markets. Iconic devices like the Game Boy (118.69 million) and the Wii (101.63 million) prove that accessible, "fun" design often outsells raw graphical power.
Microsoft’s journey in the "console wars" tells a different story. The Xbox 360 (85.73 million) remains their high-water mark, driven by superior online infrastructure via Xbox Live. However, recent years have seen a strategic pivot. While the Xbox Series X/S (34.58 million) lags behind the PS5 in hardware sales, Microsoft has shifted its focus toward subscription services like Game Pass, prioritizing software accessibility across multiple devices over physical console units.
The hardware landscape is also a graveyard of cautionary tales. The Wii U (13.56 million) and the PlayStation Vita (13.13 million) serve as reminders of the "Smartphone Extinction Event." In the early 2010s, the rise of mobile gaming cannibalized the casual handheld market, forcing dedicated hardware to offer unique value propositions that a phone could not replicate.
Looking toward the future, the Nintendo Switch 2 (18.74 million) is already making waves. Launched in mid-2025, it has achieved one of the fastest adoption rates in Nintendo’s history. By maintaining backward compatibility and refining the hybrid model, it suggests that the appetite for versatile, high-quality gaming experiences is stronger than ever.
In essence, this ranking is more than just numbers; it is a narrative of technological evolution and cultural adoption. From the pioneering days of the Atari 2600 (30 million) to the high-fidelity ecosystems of today, the consoles that succeed are those that best understand the fundamental human desire to play.
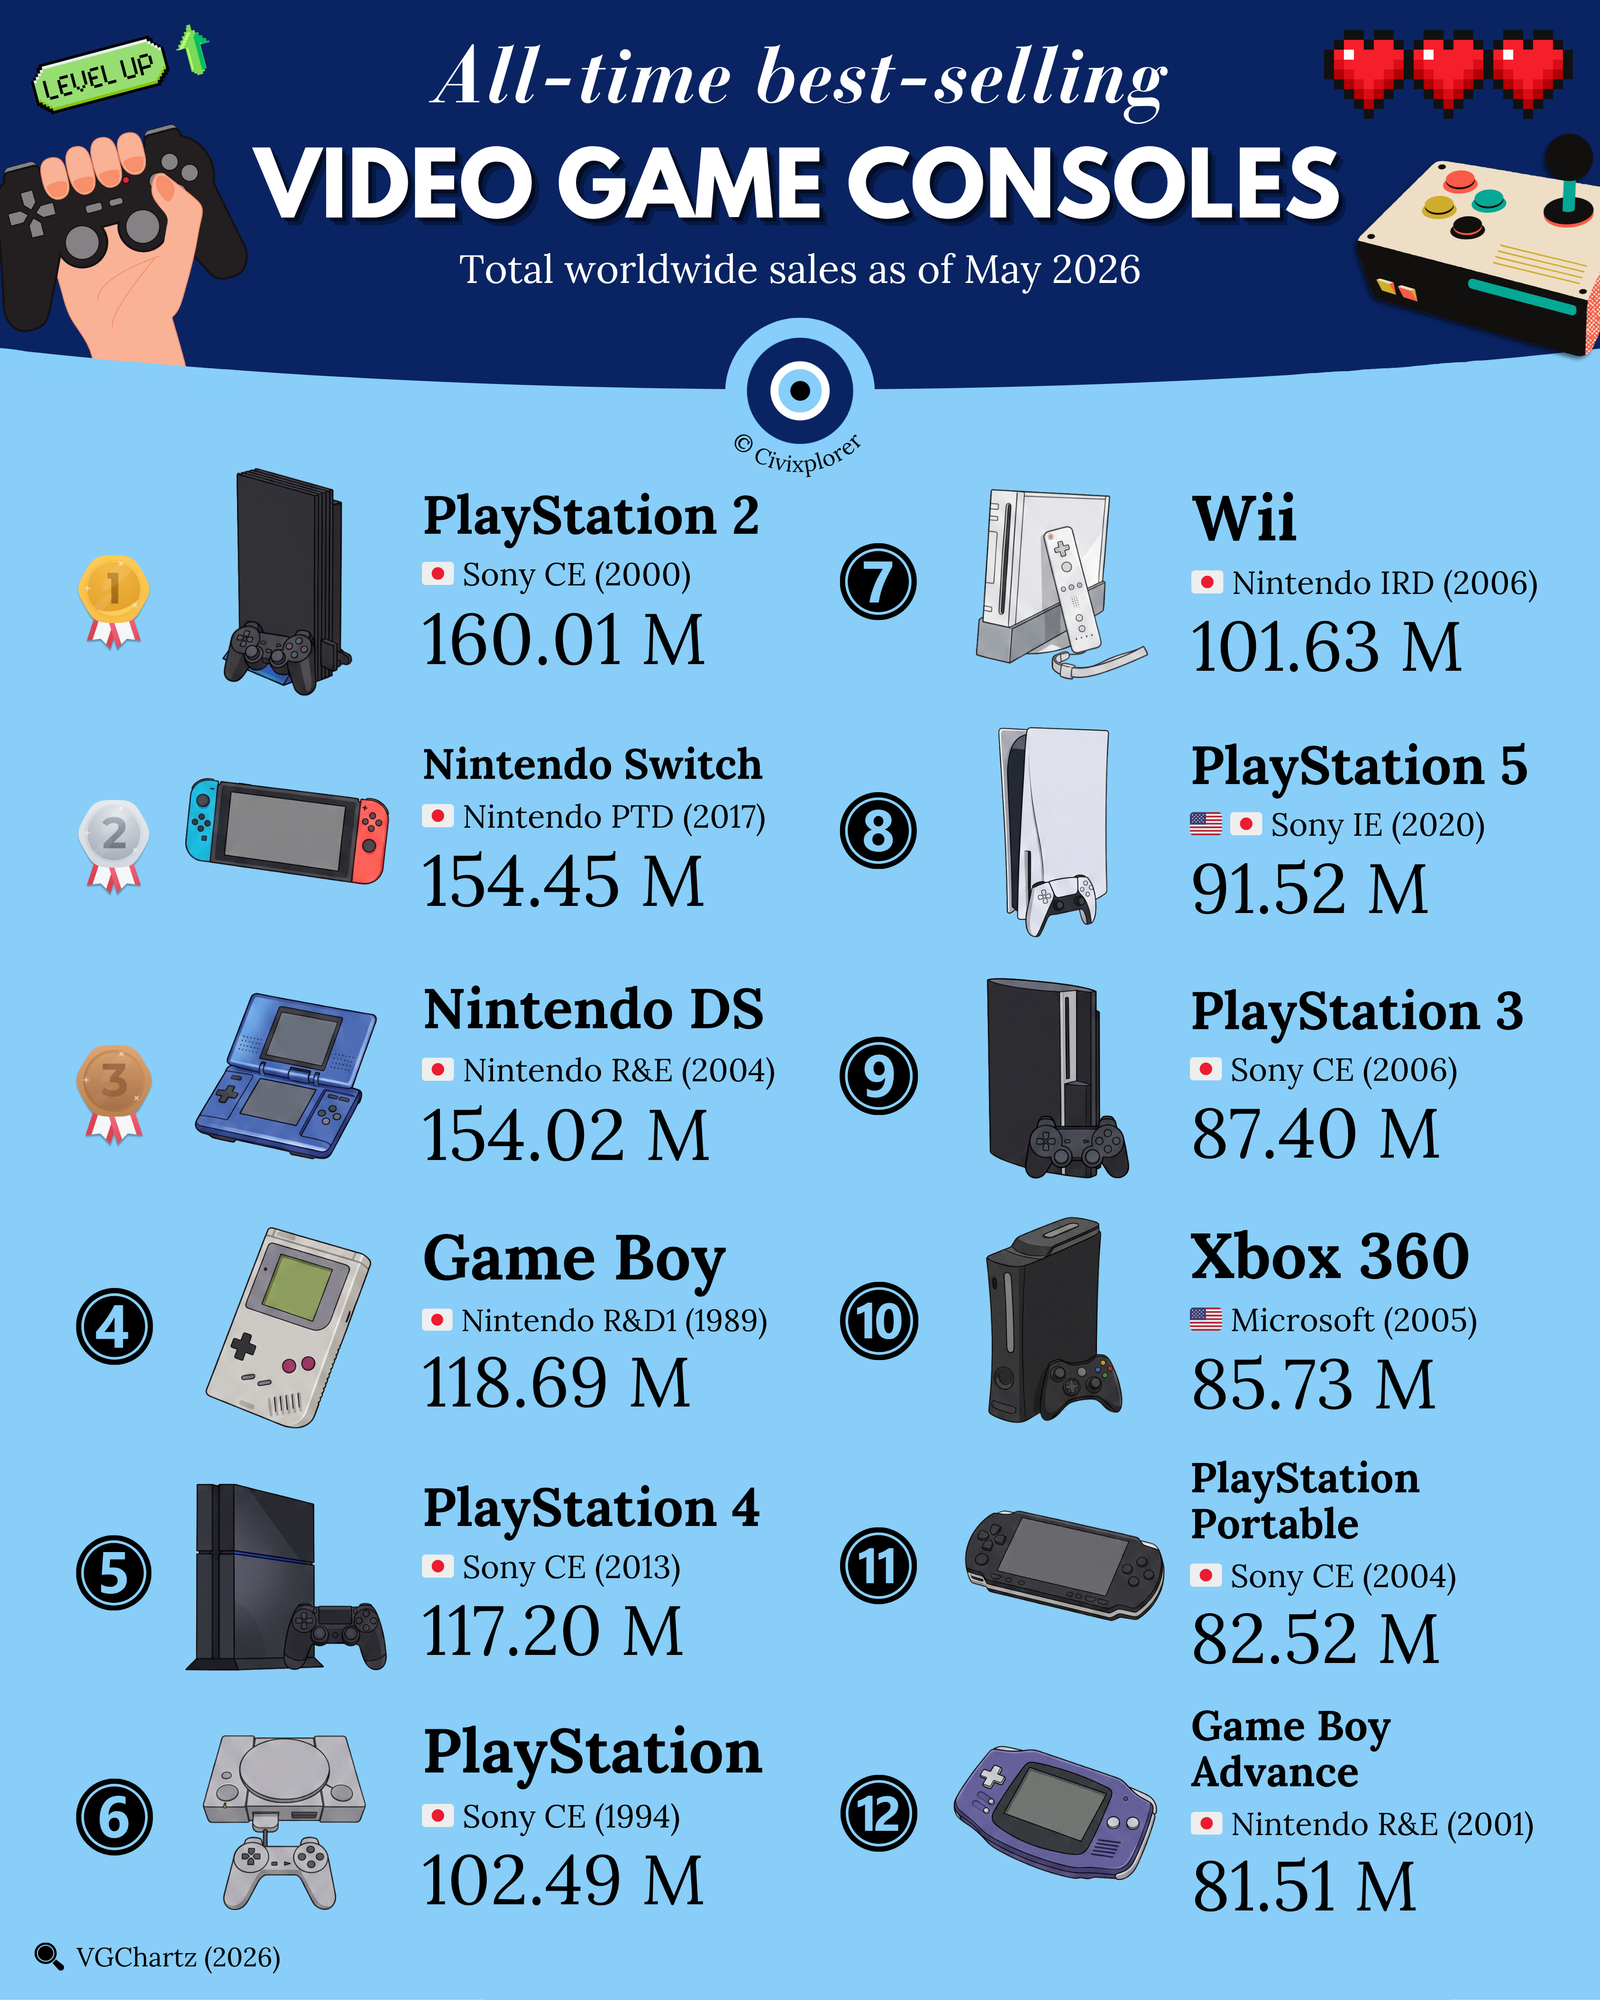
All-Time Best-Selling Video Game Consoles (Data as of May 2026)
| Position | Console | Developer | Year | Sales (Millions) |
|---|---|---|---|---|
| 1 | PlayStation 2 | Sony CE | 2000 | 160.01 M |
| 2 | Nintendo Switch | Nintendo PTD | 2017 | 154.45 M |
| 3 | Nintendo DS | Nintendo R&E | 2004 | 154.02 M |
| 4 | Game Boy | Nintendo R&D1 | 1989 | 118.69 M |
| 5 | PlayStation 4 | Sony CE | 2013 | 117.20 M |
| 6 | PlayStation | Sony CE | 1994 | 102.49 M |
| 7 | Wii | Nintendo IRD | 2006 | 101.63 M |
| 8 | PlayStation 5 | Sony IE | 2020 | 91.52 M |
| 9 | PlayStation 3 | Sony CE | 2006 | 87.40 M |
| 10 | Xbox 360 | Microsoft | 2005 | 85.73 M |
| 11 | PlayStation Portable | Sony CE | 2004 | 82.52 M |
| 12 | Game Boy Advance | Nintendo R&E | 2001 | 81.51 M |
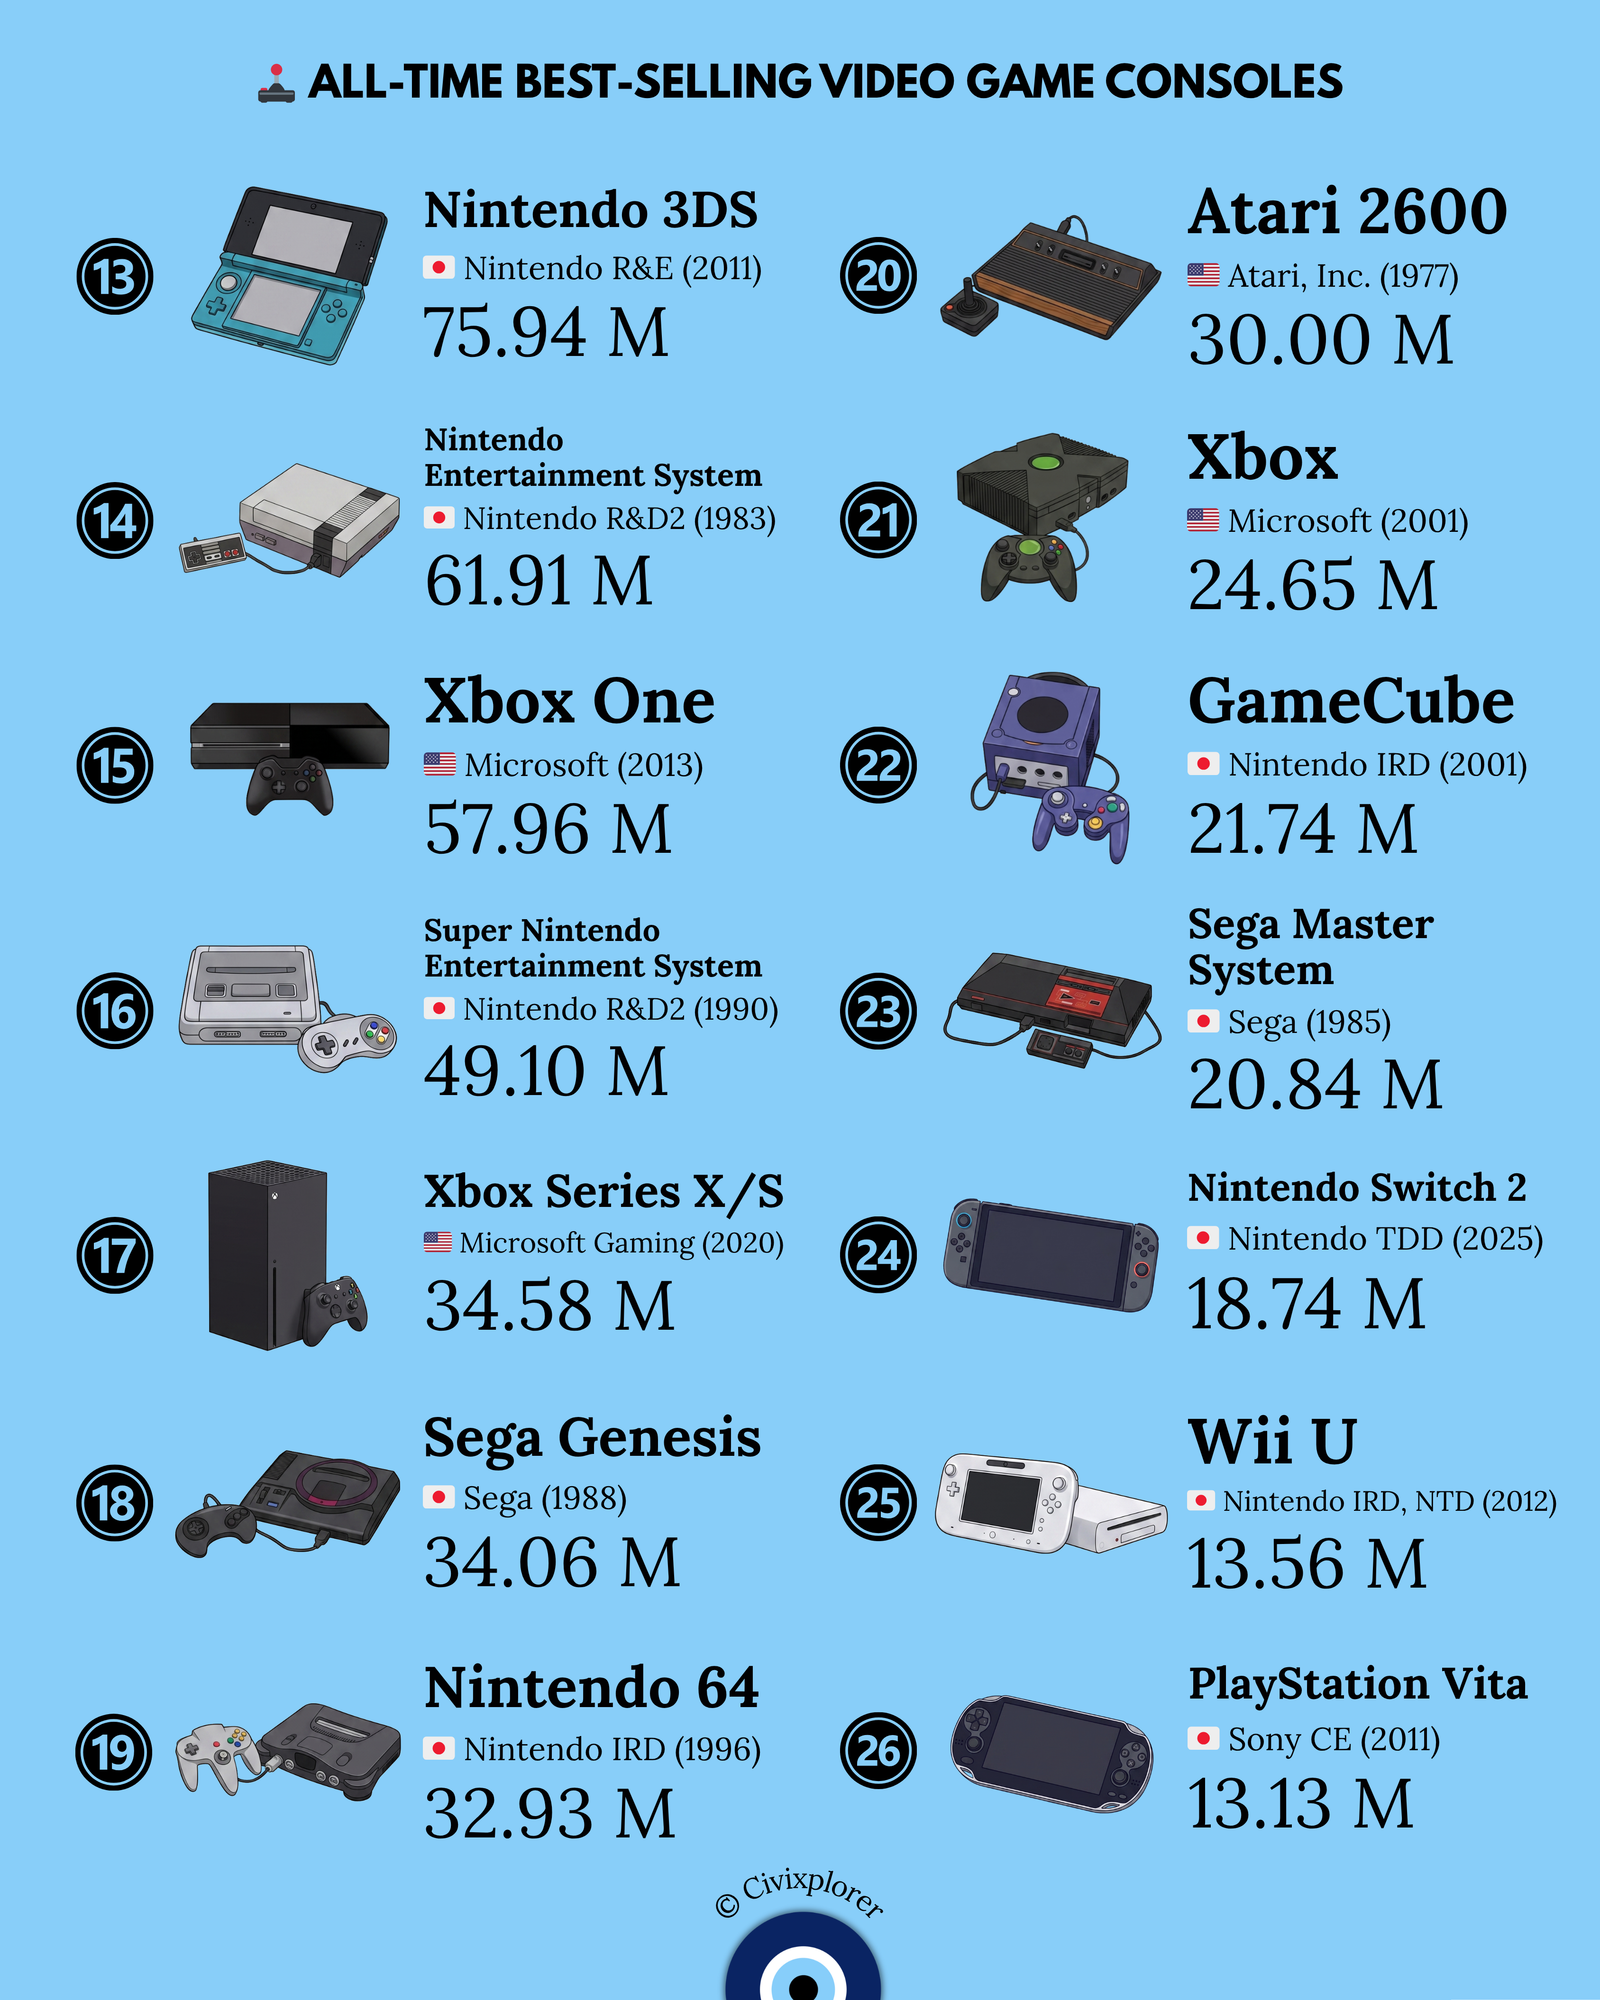
| 13 | Nintendo 3DS | Nintendo R&E | 2011 | 75.94 M |
| 14 | Nintendo Entertainment System | Nintendo R&D2 | 1983 | 61.91 M |
| 15 | Xbox One | Microsoft | 2013 | 57.96 M |
| 16 | Super Nintendo Entertainment System | Nintendo R&D2 | 1990 | 49.10 M |
| 17 | Xbox Series X/S | Microsoft Gaming | 2020 | 34.58 M |
| 18 | Sega Genesis | Sega | 1988 | 34.06 M |
| 19 | Nintendo 64 | Nintendo IRD | 1996 | 32.93 M |
| 20 | Atari 2600 | Atari, Inc. | 1977 | 30.00 M |
| 21 | Xbox | Microsoft | 2001 | 24.65 M |
| 22 | GameCube | Nintendo IRD | 2001 | 21.74 M |
| 23 | Sega Master System | Sega | 1985 | 20.84 M |
| 24 | Nintendo Switch 2 | Nintendo TDD | 2025 | 18.74 M |
| 25 | Wii U | Nintendo IRD, NTD | 2012 | 13.56 M |
| 26 | PlayStation Vita | Sony CE | 2011 | 13.13 M |

Comments (0)
Join the Conversation
Login to share your thoughts with the community.
Login to Comment